An exercise can have a plausible rationale and still fail to produce the expected benefit under a particular test. For a player-development department, that result is useful: it identifies a claim that has not earned a place in the next training decision.
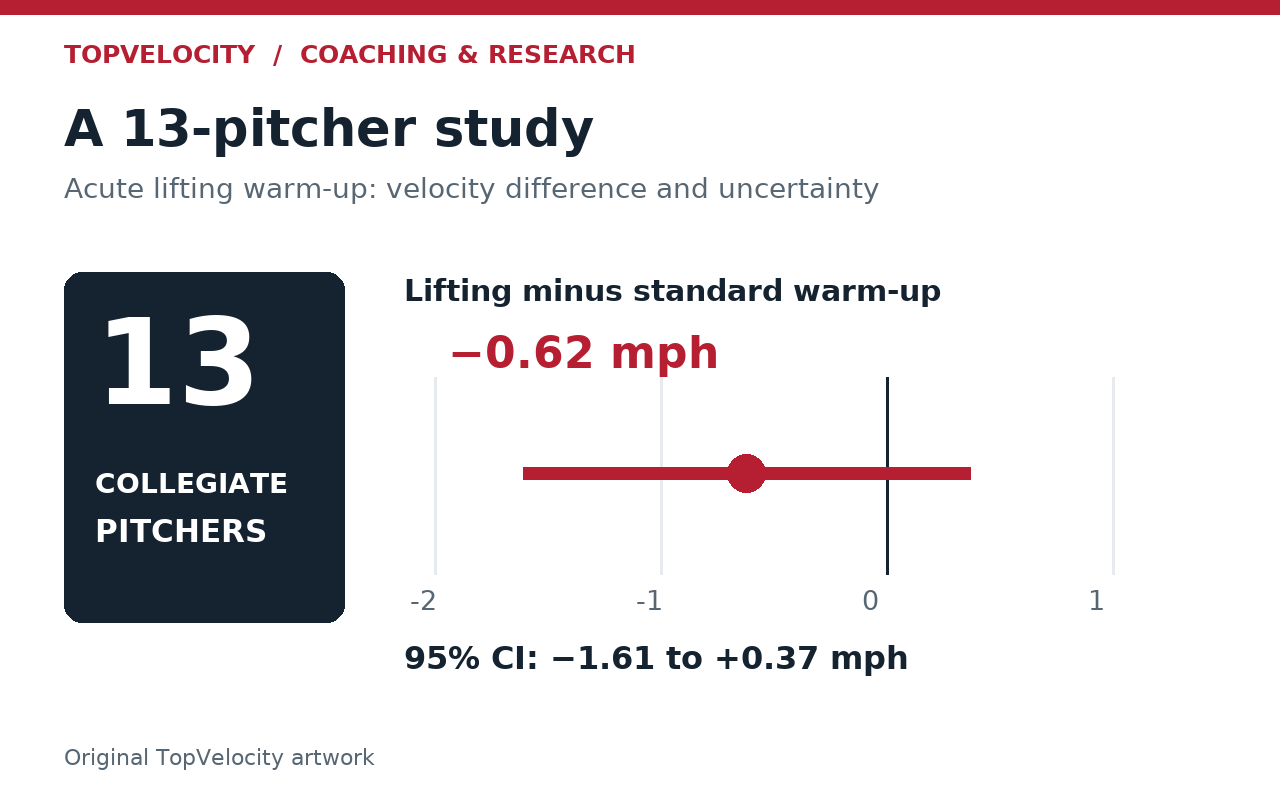
Thirteen collegiate pitchers; mean acute velocity difference minus 0.62 mph, with 95 percent confidence interval minus 1.61 to plus 0.37 mph. Source: author manuscript Table 4.2.
Brent Pourciau’s doctoral dissertation examined an Olympic-lifting sequence before pitching in collegiate pitchers. The public abstract reports no statistically significant condition differences in velocity, spin, pitch movement or target-contact percentage. Individual changes varied. The study did not demonstrate an acute group-level advantage for the tested sequence. Read the university repository abstract.
For professional baseball staff, the useful question is what this result permits us to conclude—and what experiment would be needed before changing a pitcher’s preparation.
What question did the study actually test?
The author manuscript for Acute Effects of Olympic Lifting Post-Activation Potentiation on Baseball Pitching Velocity and Ball Flight: A Crossover Study describes a comparison of two preparation conditions in 13 pitchers within the same session. Each athlete completed both conditions, with order randomized and counterbalanced.
The author manuscript describes male collegiate pitchers with limited advanced Olympic-lifting experience. After a standard warm-up, the experimental sequence used clean pulls, power cleans and power jerks at prescribed loads, followed by a specified three-minute period before pitching. Ten maximal-effort fastballs were collected in each condition. TrackMan supplied ball-flight measurements.
This design addresses a narrow question: did this sequence, with this timing and these athletes, change the immediate pitching outcomes? It does not evaluate months of strength development, the entire 3X training program or the effectiveness of a commercial analysis tool. The participants were collegiate pitchers, not an MLB cohort.
The result includes uncertainty
The author manuscript’s summary table provides the following paired differences. A positive value means the Olympic-lifting condition was higher; a negative value means it was lower. For horizontal break, a positive difference simply describes the recorded direction of change, not superior pitch quality.
| Outcome | Mean paired difference | 95% confidence interval |
|---|---|---|
| Velocity | −0.62 mph | −1.61 to +0.37 mph |
| Spin rate | −22.5 rpm | −70.3 to +25.2 rpm |
| Induced vertical break | −0.43 inches | −1.53 to +0.68 inches |
| Horizontal break | +0.09 inches | −0.63 to +0.81 inches |
| Target contact | +6.2 percentage points | −11.4 to +23.7 percentage points |
Source distinction: These numerical results come from the author manuscript supplied by Pourciau. The publicly accessible repository abstract supports the qualitative conclusion above. The deposited full PDF was not independently matched to this manuscript during preparation of this article. The dissertation is original doctoral research; it is not presented here as a peer-reviewed journal publication.
The velocity point estimate favored the standard condition, but its interval crossed zero. The data did not establish a reliable group advantage for either preparation condition on this endpoint. They also did not establish equivalence.
An equivalence claim requires a predefined range of differences small enough to disregard for the intended decision, together with evidence sufficiently precise to support that claim. A nonsignificant result alone cannot supply it. Conversely, an interval that permits some benefit does not demonstrate that the benefit exists.
The same discipline applies to target contact. Its average increased, but the interval was broad. Selecting that positive average while ignoring its uncertainty would create a stronger story than the study supports.
Three details matter when interpreting the result
The athlete is the comparison unit. Although each pitcher supplied multiple fastballs, the analysis used participant-level means. Those throws improve the description of each session; they do not turn 13 pitchers into hundreds of independent participants. The manuscript reports a planned sample of approximately 34, while the final analysis included 13. Precision must be judged from the resulting uncertainty.
Sequence effects remain possible. The manuscript describes a five-minute seated interval between pitching trials. Randomizing order helps address systematic order effects, but that interval cannot guarantee the disappearance of fatigue or potentiation from the preceding activity. A same-session crossover therefore carries an interpretation problem that a replication should address explicitly.
The location task has boundaries. Target-contact percentage described contact with an indoor target. It was not umpire-called strike percentage, intended-target error measured continuously, or proof of improved competitive command. Its relevance depends on the baseball decision a club wants to make.
Acute preparation and long-term development need different tests
A department deciding whether to add lifting immediately before a bullpen needs evidence about that preparation choice. A department deciding whether to develop strength or power across a training block needs an intervention and follow-up suited to that longer question.
This study should not be used to collapse those decisions. It neither validates a chronic Olympic-lifting program nor demonstrates that chronic training cannot help. It also does not supply an injury-prevention result. The manuscript reviewed for this article did not contain a clear adverse-event count, so this report makes no claim of zero adverse events or established safety.
For TopVelocity, the appropriate response is to describe the finding accurately and make the next question testable. A research result is most useful when its limits guide the next decision.
Individual improvement still needs confirmation
The abstract notes variable individual responses. A single positive difference should not automatically label an athlete a dependable responder. That difference can include ordinary session variation, measurement uncertainty, effort, order and the athlete’s recent activity.
A proposed follow-up would repeat compatible assessments before assigning that label. Staff would look for a change that is consistently available under the intended conditions and large enough to matter for the athlete’s role. The same standard should apply to an apparent decline.
Repeated measurement would strengthen the individual interpretation; it would not by itself identify a biological mechanism or establish improved game performance.
Turn the finding into a club-defined pilot
TopVelocity proposes organizing a professional collaboration around three questions:
- What is the decision? Identify the athlete group, preparation change, primary outcome and capabilities that must be preserved. Set a practically worthwhile change before seeing the results.
- Can the comparison answer it? Agree on equipment, pitch type, effort, recent exposure, recovery conditions and repeated testing. Have club analysts address order, carryover and the separation of athlete-level and pitch-level observations.
- What happens afterward? Predefine whether the findings support continuing, revising or stopping the proposed change. Include uncertainty, incomplete sessions, withdrawals and medical restrictions in that review.
The roster, schedule and design would be scoped with the club. Its coaching and medical staff would retain authority over participation and training decisions. A successful project could produce a useful decision to leave an athlete’s preparation unchanged.
Discuss a professional research or player-development project with Brent. Start with the question your department needs answered and the evidence required to act on it.